

Axes.magnitude_spectrum(x, Fs=None, Fc=None, window=None, pad_to=None, sides=None, scale=None, **kwargs)¶Plot the magnitude spectrum.
Call signature:
magnitude_spectrum(x, Fs=2, Fc=0,  window=mlab.window_hanning,
                   pad_to=None, sides='default', **kwargs)
Compute the magnitude spectrum of x. Data is padded to a length of pad_to and the windowing function window is applied to the signal.
- x: 1-D array or sequence
- Array or sequence containing the data
Keyword arguments:
- Fs: scalar
- The sampling frequency (samples per time unit). It is used to calculate the Fourier frequencies, freqs, in cycles per time unit. The default value is 2.
- window: callable or ndarray
- A function or a vector of length NFFT. To create window vectors see
window_hanning(),window_none(),numpy.blackman(),numpy.hamming(),numpy.bartlett(),scipy.signal(),scipy.signal.get_window(), etc. The default iswindow_hanning(). If a function is passed as the argument, it must take a data segment as an argument and return the windowed version of the segment.- sides: [ ‘default’ | ‘onesided’ | ‘twosided’ ]
- Specifies which sides of the spectrum to return. Default gives the default behavior, which returns one-sided for real data and both for complex data. ‘onesided’ forces the return of a one-sided spectrum, while ‘twosided’ forces two-sided.
The number of points to which the data segment is padded when performing the FFT. While not increasing the actual resolution of the spectrum (the minimum distance between resolvable peaks), this can give more points in the plot, allowing for more detail. This corresponds to the n parameter in the call to fft(). The default is None, which sets pad_to equal to the length of the input signal (i.e. no padding).
Returns the tuple (spectrum, freqs, line):
- spectrum: 1-D array
- The values for the magnitude spectrum before scaling (real valued)
- freqs: 1-D array
- The frequencies corresponding to the elements in spectrum
- line: a
Line2Dinstance- The line created by this function
kwargs control the Line2D properties:
Property Description agg_filterunknown alphafloat (0.0 transparent through 1.0 opaque) animated[True | False] antialiasedor aa[True | False] axesan Axesinstancebottom_marginunknown clip_boxa matplotlib.transforms.Bboxinstanceclip_on[True | False] clip_path[ ( Path,Transform) |Patch| None ]coloror cany matplotlib color containsa callable function dash_capstyle[‘butt’ | ‘round’ | ‘projecting’] dash_joinstyle[‘miter’ | ‘round’ | ‘bevel’] dashessequence of on/off ink in points drawstyle[‘default’ | ‘steps’ | ‘steps-pre’ | ‘steps-mid’ | ‘steps-post’] figurea matplotlib.figure.Figureinstancefillstyle[‘full’ | ‘left’ | ‘right’ | ‘bottom’ | ‘top’ | ‘none’] gidan id string labelstring or anything printable with ‘%s’ conversion. left_marginunknown linestyleor ls[‘solid’ | ‘dashed’, ‘dashdot’, ‘dotted’ | (offset, on-off-dash-seq) | '-'|'--'|'-.'|':'|'None'|' '|'']linewidthor lwfloat value in points marginsunknown markerA valid marker stylemarkeredgecoloror mecany matplotlib color markeredgewidthor mewfloat value in points markerfacecoloror mfcany matplotlib color markerfacecoloraltor mfcaltany matplotlib color markersizeor msfloat markevery[None | int | length-2 tuple of int | slice | list/array of int | float | length-2 tuple of float] path_effectsunknown pickerfloat distance in points or callable pick function fn(artist, event)pickradiusfloat distance in points rasterized[True | False | None] right_marginunknown sketch_paramsunknown snapunknown solid_capstyle[‘butt’ | ‘round’ | ‘projecting’] solid_joinstyle[‘miter’ | ‘round’ | ‘bevel’] top_marginunknown transforma matplotlib.transforms.Transforminstanceurla url string visible[True | False] xdata1D array ydata1D array zorderany number
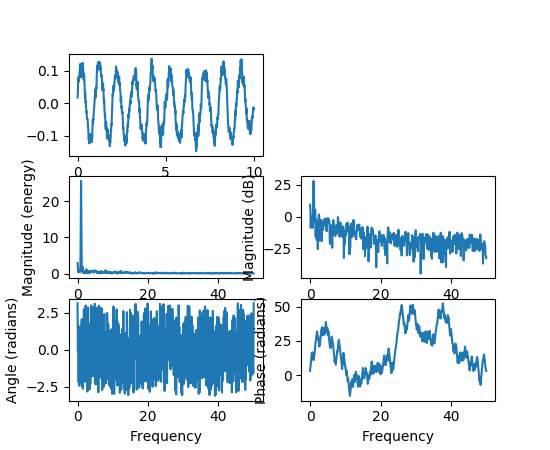
Example:
(Source code, png, pdf)
See also
psd()psd() plots the power spectral density.`.angle_spectrum()angle_spectrum() plots the angles of the corresponding
frequencies.phase_spectrum()phase_spectrum() plots the phase (unwrapped angle) of the
corresponding frequencies.specgram()specgram() can plot the magnitude spectrum of segments
within the signal in a colormap.Notes
In addition to the above described arguments, this function can take a data keyword argument. If such a data argument is given, the following arguments are replaced by data[<arg>]: