

Axes.csd(x, y, NFFT=None, Fs=None, Fc=None, detrend=None, window=None, noverlap=None, pad_to=None, sides=None, scale_by_freq=None, return_line=None, **kwargs)¶Plot the cross-spectral density.
Call signature:
csd(x, y, NFFT=256, Fs=2, Fc=0, detrend=mlab.detrend_none,
    window=mlab.window_hanning, noverlap=0, pad_to=None,
    sides='default', scale_by_freq=None, return_line=None, **kwargs)
The cross spectral density  by Welch’s average
periodogram method. The vectors x and y are divided into
NFFT length segments. Each segment is detrended by function
detrend and windowed by function window. noverlap gives
the length of the overlap between segments. The product of
the direct FFTs of x and y are averaged over each segment
to compute , with a scaling to correct for power
loss due to windowing.
by Welch’s average
periodogram method. The vectors x and y are divided into
NFFT length segments. Each segment is detrended by function
detrend and windowed by function window. noverlap gives
the length of the overlap between segments. The product of
the direct FFTs of x and y are averaged over each segment
to compute , with a scaling to correct for power
loss due to windowing.
If len(x) < NFFT or len(y) < NFFT, they will be zero padded to NFFT.
- x, y: 1-D arrays or sequences
- Arrays or sequences containing the data
Keyword arguments:
- Fs: scalar
- The sampling frequency (samples per time unit). It is used to calculate the Fourier frequencies, freqs, in cycles per time unit. The default value is 2.
- window: callable or ndarray
- A function or a vector of length NFFT. To create window vectors see
window_hanning(),window_none(),numpy.blackman(),numpy.hamming(),numpy.bartlett(),scipy.signal(),scipy.signal.get_window(), etc. The default iswindow_hanning(). If a function is passed as the argument, it must take a data segment as an argument and return the windowed version of the segment.- sides: [ ‘default’ | ‘onesided’ | ‘twosided’ ]
- Specifies which sides of the spectrum to return. Default gives the default behavior, which returns one-sided for real data and both for complex data. ‘onesided’ forces the return of a one-sided spectrum, while ‘twosided’ forces two-sided.
callable
The function applied to each segment before fft-ing,
designed to remove the mean or linear trend. Unlike in
MATLAB, where the detrend parameter is a vector, in
matplotlib is it a function. The pylab
module defines detrend_none(),
detrend_mean(), and
detrend_linear(), but you can use
a custom function as well. You can also use a string to choose
one of the functions. ‘default’, ‘constant’, and ‘mean’ call
detrend_mean(). ‘linear’ calls
detrend_linear(). ‘none’ calls
detrend_none().
Specifies whether the resulting density values should be scaled by the scaling frequency, which gives density in units of Hz^-1. This allows for integration over the returned frequency values. The default is True for MATLAB compatibility.
If return_line is False, returns the tuple (Pxy, freqs). If return_line is True, returns the tuple (Pxy, freqs. line):
- Pxy: 1-D array
- The values for the cross spectrum
P_{xy}before scaling (complex valued)- freqs: 1-D array
- The frequencies corresponding to the elements in Pxy
- line: a
Line2Dinstance- The line created by this function. Only returend if return_line is True.
For plotting, the power is plotted as
 for decibels, though
 P_{xy} itself
is returned.
kwargs control the Line2D properties:
Property Description agg_filterunknown alphafloat (0.0 transparent through 1.0 opaque) animated[True | False] antialiasedor aa[True | False] axesan Axesinstancebottom_marginunknown clip_boxa matplotlib.transforms.Bboxinstanceclip_on[True | False] clip_path[ ( Path,Transform) |Patch| None ]coloror cany matplotlib color containsa callable function dash_capstyle[‘butt’ | ‘round’ | ‘projecting’] dash_joinstyle[‘miter’ | ‘round’ | ‘bevel’] dashessequence of on/off ink in points drawstyle[‘default’ | ‘steps’ | ‘steps-pre’ | ‘steps-mid’ | ‘steps-post’] figurea matplotlib.figure.Figureinstancefillstyle[‘full’ | ‘left’ | ‘right’ | ‘bottom’ | ‘top’ | ‘none’] gidan id string labelstring or anything printable with ‘%s’ conversion. left_marginunknown linestyleor ls[‘solid’ | ‘dashed’, ‘dashdot’, ‘dotted’ | (offset, on-off-dash-seq) | '-'|'--'|'-.'|':'|'None'|' '|'']linewidthor lwfloat value in points marginsunknown markerA valid marker stylemarkeredgecoloror mecany matplotlib color markeredgewidthor mewfloat value in points markerfacecoloror mfcany matplotlib color markerfacecoloraltor mfcaltany matplotlib color markersizeor msfloat markevery[None | int | length-2 tuple of int | slice | list/array of int | float | length-2 tuple of float] path_effectsunknown pickerfloat distance in points or callable pick function fn(artist, event)pickradiusfloat distance in points rasterized[True | False | None] right_marginunknown sketch_paramsunknown snapunknown solid_capstyle[‘butt’ | ‘round’ | ‘projecting’] solid_joinstyle[‘miter’ | ‘round’ | ‘bevel’] top_marginunknown transforma matplotlib.transforms.Transforminstanceurla url string visible[True | False] xdata1D array ydata1D array zorderany number
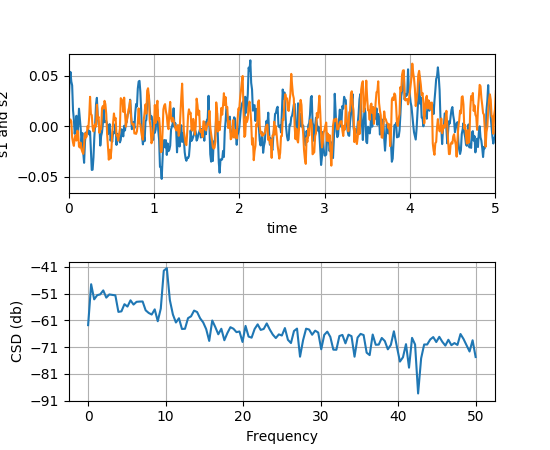
Example:
(Source code, png, pdf)
Notes
In addition to the above described arguments, this function can take a data keyword argument. If such a data argument is given, the following arguments are replaced by data[<arg>]: