

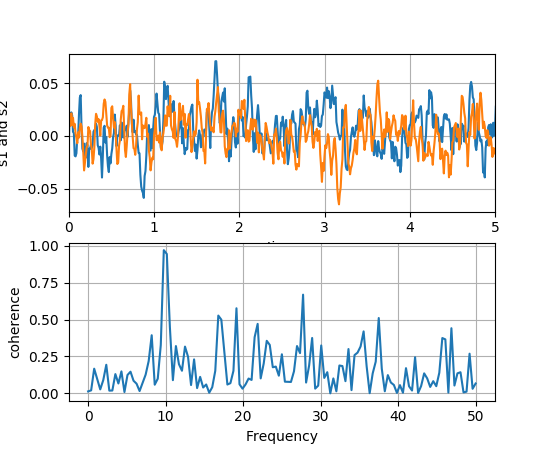
Axes.cohere(x, y, NFFT=256, Fs=2, Fc=0, detrend=<function detrend_none>, window=<function window_hanning>, noverlap=0, pad_to=None, sides='default', scale_by_freq=None, **kwargs)¶Plot the coherence between x and y.
Call signature:
cohere(x, y, NFFT=256, Fs=2, Fc=0, detrend = mlab.detrend_none,
       window = mlab.window_hanning, noverlap=0, pad_to=None,
       sides='default', scale_by_freq=None, **kwargs)
Plot the coherence between x and y. Coherence is the normalized cross spectral density:

Keyword arguments:
- Fs: scalar
- The sampling frequency (samples per time unit). It is used to calculate the Fourier frequencies, freqs, in cycles per time unit. The default value is 2.
- window: callable or ndarray
- A function or a vector of length NFFT. To create window vectors see
window_hanning(),window_none(),numpy.blackman(),numpy.hamming(),numpy.bartlett(),scipy.signal(),scipy.signal.get_window(), etc. The default iswindow_hanning(). If a function is passed as the argument, it must take a data segment as an argument and return the windowed version of the segment.- sides: [ ‘default’ | ‘onesided’ | ‘twosided’ ]
- Specifies which sides of the spectrum to return. Default gives the default behavior, which returns one-sided for real data and both for complex data. ‘onesided’ forces the return of a one-sided spectrum, while ‘twosided’ forces two-sided.
callable
The function applied to each segment before fft-ing,
designed to remove the mean or linear trend. Unlike in
MATLAB, where the detrend parameter is a vector, in
matplotlib is it a function. The pylab
module defines detrend_none(),
detrend_mean(), and
detrend_linear(), but you can use
a custom function as well. You can also use a string to choose
one of the functions. ‘default’, ‘constant’, and ‘mean’ call
detrend_mean(). ‘linear’ calls
detrend_linear(). ‘none’ calls
detrend_none().
Specifies whether the resulting density values should be scaled by the scaling frequency, which gives density in units of Hz^-1. This allows for integration over the returned frequency values. The default is True for MATLAB compatibility.
The return value is a tuple (Cxy, f), where f are the frequencies of the coherence vector.
kwargs are applied to the lines.
References:
- Bendat & Piersol – Random Data: Analysis and Measurement Procedures, John Wiley & Sons (1986)
kwargs control the Line2D
properties of the coherence plot:
Property Description agg_filterunknown alphafloat (0.0 transparent through 1.0 opaque) animated[True | False] antialiasedor aa[True | False] axesan Axesinstancebottom_marginunknown clip_boxa matplotlib.transforms.Bboxinstanceclip_on[True | False] clip_path[ ( Path,Transform) |Patch| None ]coloror cany matplotlib color containsa callable function dash_capstyle[‘butt’ | ‘round’ | ‘projecting’] dash_joinstyle[‘miter’ | ‘round’ | ‘bevel’] dashessequence of on/off ink in points drawstyle[‘default’ | ‘steps’ | ‘steps-pre’ | ‘steps-mid’ | ‘steps-post’] figurea matplotlib.figure.Figureinstancefillstyle[‘full’ | ‘left’ | ‘right’ | ‘bottom’ | ‘top’ | ‘none’] gidan id string labelstring or anything printable with ‘%s’ conversion. left_marginunknown linestyleor ls[‘solid’ | ‘dashed’, ‘dashdot’, ‘dotted’ | (offset, on-off-dash-seq) | '-'|'--'|'-.'|':'|'None'|' '|'']linewidthor lwfloat value in points marginsunknown markerA valid marker stylemarkeredgecoloror mecany matplotlib color markeredgewidthor mewfloat value in points markerfacecoloror mfcany matplotlib color markerfacecoloraltor mfcaltany matplotlib color markersizeor msfloat markevery[None | int | length-2 tuple of int | slice | list/array of int | float | length-2 tuple of float] path_effectsunknown pickerfloat distance in points or callable pick function fn(artist, event)pickradiusfloat distance in points rasterized[True | False | None] right_marginunknown sketch_paramsunknown snapunknown solid_capstyle[‘butt’ | ‘round’ | ‘projecting’] solid_joinstyle[‘miter’ | ‘round’ | ‘bevel’] top_marginunknown transforma matplotlib.transforms.Transforminstanceurla url string visible[True | False] xdata1D array ydata1D array zorderany number
Example:
(Source code, png, pdf)

Notes
In addition to the above described arguments, this function can take a data keyword argument. If such a data argument is given, the following arguments are replaced by data[<arg>]: