

Axes.loglog(*args, **kwargs)¶Make a plot with log scaling on both the x and y axis.
Call signature:
loglog(*args, **kwargs)
loglog() supports all the keyword
arguments of plot() and
matplotlib.axes.Axes.set_xscale() /
matplotlib.axes.Axes.set_yscale().
Notable keyword arguments:
- basex/basey: scalar > 1
- Base of the x/y logarithm
- subsx/subsy: [ None | sequence ]
- The location of the minor x/y ticks; None defaults to autosubs, which depend on the number of decades in the plot; see
matplotlib.axes.Axes.set_xscale()/matplotlib.axes.Axes.set_yscale()for details- nonposx/nonposy: [‘mask’ | ‘clip’ ]
- Non-positive values in x or y can be masked as invalid, or clipped to a very small positive number
The remaining valid kwargs are
Line2D properties:
Property Description agg_filterunknown alphafloat (0.0 transparent through 1.0 opaque) animated[True | False] antialiasedor aa[True | False] axesan Axesinstancebottom_marginunknown clip_boxa matplotlib.transforms.Bboxinstanceclip_on[True | False] clip_path[ ( Path,Transform) |Patch| None ]coloror cany matplotlib color containsa callable function dash_capstyle[‘butt’ | ‘round’ | ‘projecting’] dash_joinstyle[‘miter’ | ‘round’ | ‘bevel’] dashessequence of on/off ink in points drawstyle[‘default’ | ‘steps’ | ‘steps-pre’ | ‘steps-mid’ | ‘steps-post’] figurea matplotlib.figure.Figureinstancefillstyle[‘full’ | ‘left’ | ‘right’ | ‘bottom’ | ‘top’ | ‘none’] gidan id string labelstring or anything printable with ‘%s’ conversion. left_marginunknown linestyleor ls[‘solid’ | ‘dashed’, ‘dashdot’, ‘dotted’ | (offset, on-off-dash-seq) | '-'|'--'|'-.'|':'|'None'|' '|'']linewidthor lwfloat value in points marginsunknown markerA valid marker stylemarkeredgecoloror mecany matplotlib color markeredgewidthor mewfloat value in points markerfacecoloror mfcany matplotlib color markerfacecoloraltor mfcaltany matplotlib color markersizeor msfloat markevery[None | int | length-2 tuple of int | slice | list/array of int | float | length-2 tuple of float] path_effectsunknown pickerfloat distance in points or callable pick function fn(artist, event)pickradiusfloat distance in points rasterized[True | False | None] right_marginunknown sketch_paramsunknown snapunknown solid_capstyle[‘butt’ | ‘round’ | ‘projecting’] solid_joinstyle[‘miter’ | ‘round’ | ‘bevel’] top_marginunknown transforma matplotlib.transforms.Transforminstanceurla url string visible[True | False] xdata1D array ydata1D array zorderany number
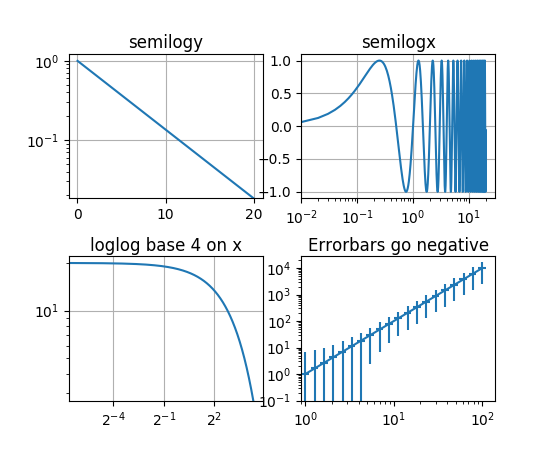
Example:
(Source code, png, pdf)