

Axes.hexbin(x, y, C=None, gridsize=100, bins=None, xscale='linear', yscale='linear', extent=None, cmap=None, norm=None, vmin=None, vmax=None, alpha=None, linewidths=None, edgecolors='none', reduce_C_function=<function mean>, mincnt=None, marginals=False, **kwargs)¶Make a hexagonal binning plot.
Call signature:
hexbin(x, y, C = None, gridsize = 100, bins = None,
       xscale = 'linear', yscale = 'linear',
       cmap=None, norm=None, vmin=None, vmax=None,
       alpha=None, linewidths=None, edgecolors='none'
       reduce_C_function = np.mean, mincnt=None, marginals=True
       **kwargs)
Make a hexagonal binning plot of x versus y, where x, y are 1-D sequences of the same length, N. If C is None (the default), this is a histogram of the number of occurences of the observations at (x[i],y[i]).
If C is specified, it specifies values at the coordinate (x[i],y[i]). These values are accumulated for each hexagonal bin and then reduced according to reduce_C_function, which defaults to numpy’s mean function (np.mean). (If C is specified, it must also be a 1-D sequence of the same length as x and y.)
x, y and/or C may be masked arrays, in which case only unmasked points will be plotted.
Optional keyword arguments:
If None, no binning is applied; the color of each hexagon directly corresponds to its count value.
If ‘log’, use a logarithmic scale for the color
map. Internally,  is used to
determine the hexagon color.
is used to
determine the hexagon color.
If an integer, divide the counts in the specified number of bins, and color the hexagons accordingly.
If a sequence of values, the values of the lower bound of the bins to be used.
The limits of the bins. The default assigns the limits based on gridsize, x, y, xscale and yscale.
If xscale or yscale is set to ‘log’, the limits are expected to be the exponent for a power of 10. E.g. for x-limits of 1 and 50 in ‘linear’ scale and y-limits of 10 and 1000 in ‘log’ scale, enter (1, 50, 1, 3).
Other keyword arguments controlling color mapping and normalization arguments:
matplotlib.colors.Colormap instance. If None,
defaults to rc image.cmap.matplotlib.colors.Normalize instance is used to
scale luminance data to 0,1.RegularPolyCollection.Other keyword arguments controlling the Collection properties:
'none' | mpl color | color sequence ]If 'none', draws the edges in the same color as the fill color.
This is the default, as it avoids unsightly unpainted pixels
between the hexagons.
If None, draws the outlines in the default color.
If a matplotlib color arg or sequence of rgba tuples, draws the outlines in the specified color.
Here are the standard descriptions of all the
Collection kwargs:
Property Description agg_filterunknown alphafloat or None animated[True | False] antialiasedor antialiasedsBoolean or sequence of booleans arrayunknown axesan Axesinstancebottom_marginunknown clima length 2 sequence of floats clip_boxa matplotlib.transforms.Bboxinstanceclip_on[True | False] clip_path[ ( Path,Transform) |Patch| None ]cmapa colormap or registered colormap name colormatplotlib color arg or sequence of rgba tuples containsa callable function edgecoloror edgecolorsmatplotlib color spec or sequence of specs facecoloror facecolorsmatplotlib color spec or sequence of specs figurea matplotlib.figure.Figureinstancegidan id string hatch[ ‘/’ | ‘\’ | ‘|’ | ‘-‘ | ‘+’ | ‘x’ | ‘o’ | ‘O’ | ‘.’ | ‘*’ ] labelstring or anything printable with ‘%s’ conversion. left_marginunknown linestyleor dashes or linestyles[‘solid’ | ‘dashed’, ‘dashdot’, ‘dotted’ | (offset, on-off-dash-seq) | '-'|'--'|'-.'|':'|'None'|' '|'']linewidthor linewidths or lwfloat or sequence of floats marginsunknown normunknown offset_positionunknown offsetsfloat or sequence of floats path_effectsunknown picker[None|float|boolean|callable] pickradiusunknown rasterized[True | False | None] right_marginunknown sketch_paramsunknown snapunknown top_marginunknown transformTransforminstanceurla url string urlsunknown visible[True | False] zorderany number
The return value is a
PolyCollection instance; use
get_array() on
this PolyCollection to get
the counts in each hexagon. If marginals is True, horizontal
bar and vertical bar (both PolyCollections) will be attached
to the return collection as attributes hbar and vbar.
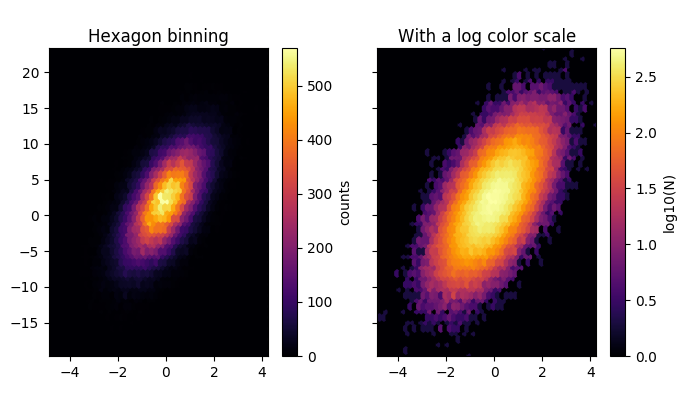
Example:
(Source code, png, pdf)

Notes
In addition to the above described arguments, this function can take a data keyword argument. If such a data argument is given, the following arguments are replaced by data[<arg>]: