

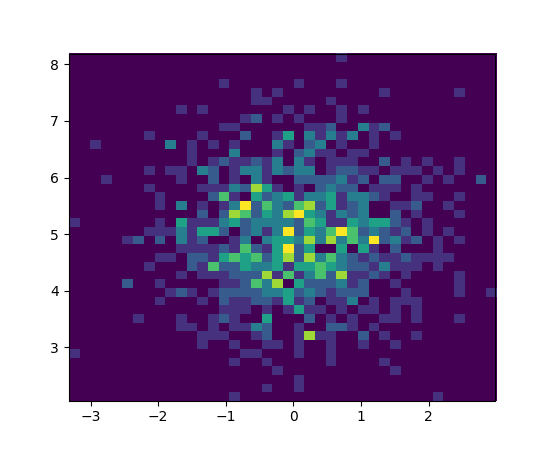
Axes.hist2d(x, y, bins=10, range=None, normed=False, weights=None, cmin=None, cmax=None, **kwargs)¶Make a 2D histogram plot.
| Parameters: | x, y: array_like, shape (n, )
bins: [None | int | [int, int] | array_like | [array, array]]
range : array_like shape(2, 2), optional, default: None
normed : boolean, optional, default: False
weights : array_like, shape (n, ), optional, default: None
cmin : scalar, optional, default: None
cmax : scalar, optional, default: None
|
|---|---|
| Returns: | The return value is |
| Other Parameters: | |
kwargs : |
|
See also
histNotes
In addition to the above described arguments, this function can take a data keyword argument. If such a data argument is given, the following arguments are replaced by data[<arg>]:
Examples
(Source code, png, pdf)
