

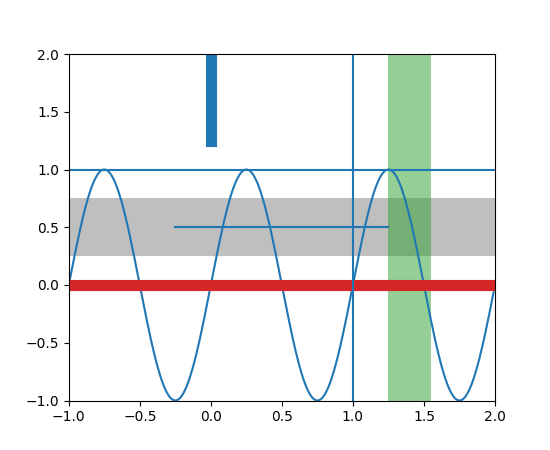
Axes.axhspan(ymin, ymax, xmin=0, xmax=1, **kwargs)¶Add a horizontal span (rectangle) across the axis.
Draw a horizontal span (rectangle) from ymin to ymax.
With the default values of xmin = 0 and xmax = 1, this
always spans the xrange, regardless of the xlim settings, even
if you change them, e.g., with the set_xlim() command.
That is, the horizontal extent is in axes coords: 0=left,
0.5=middle, 1.0=right but the y location is in data
coordinates.
| Parameters: | ymin : float
ymax : float
xmin : float, optional, default: 0
xmax : float, optional, default: 1
|
||||||||||||||||||||||||||||||||||||||||||||||||||||||||||||||||||||||||
|---|---|---|---|---|---|---|---|---|---|---|---|---|---|---|---|---|---|---|---|---|---|---|---|---|---|---|---|---|---|---|---|---|---|---|---|---|---|---|---|---|---|---|---|---|---|---|---|---|---|---|---|---|---|---|---|---|---|---|---|---|---|---|---|---|---|---|---|---|---|---|---|---|---|
| Returns: | Polygon : |
||||||||||||||||||||||||||||||||||||||||||||||||||||||||||||||||||||||||
| Other Parameters: | |||||||||||||||||||||||||||||||||||||||||||||||||||||||||||||||||||||||||
kwargs :
|
|||||||||||||||||||||||||||||||||||||||||||||||||||||||||||||||||||||||||
See also
axvspanExamples
(Source code, png, pdf)